Skip to content
Memoturn

open source · Apache-2.0

See every LLM call. On infrastructure you own.

Memoturn is an open-source AI engineering platform: tracing, cost and latency metrics, offline, online, and human evals, versioned prompts with deploy channels, monitors, and datasets. OpenTelemetry-native, self-hostable, and nothing leaves your network.

License
Apache-2.0
Telemetry
OpenTelemetry-native
SDKs
TS + Python + Go SDKs
Analytics store
Apache Doris-backed
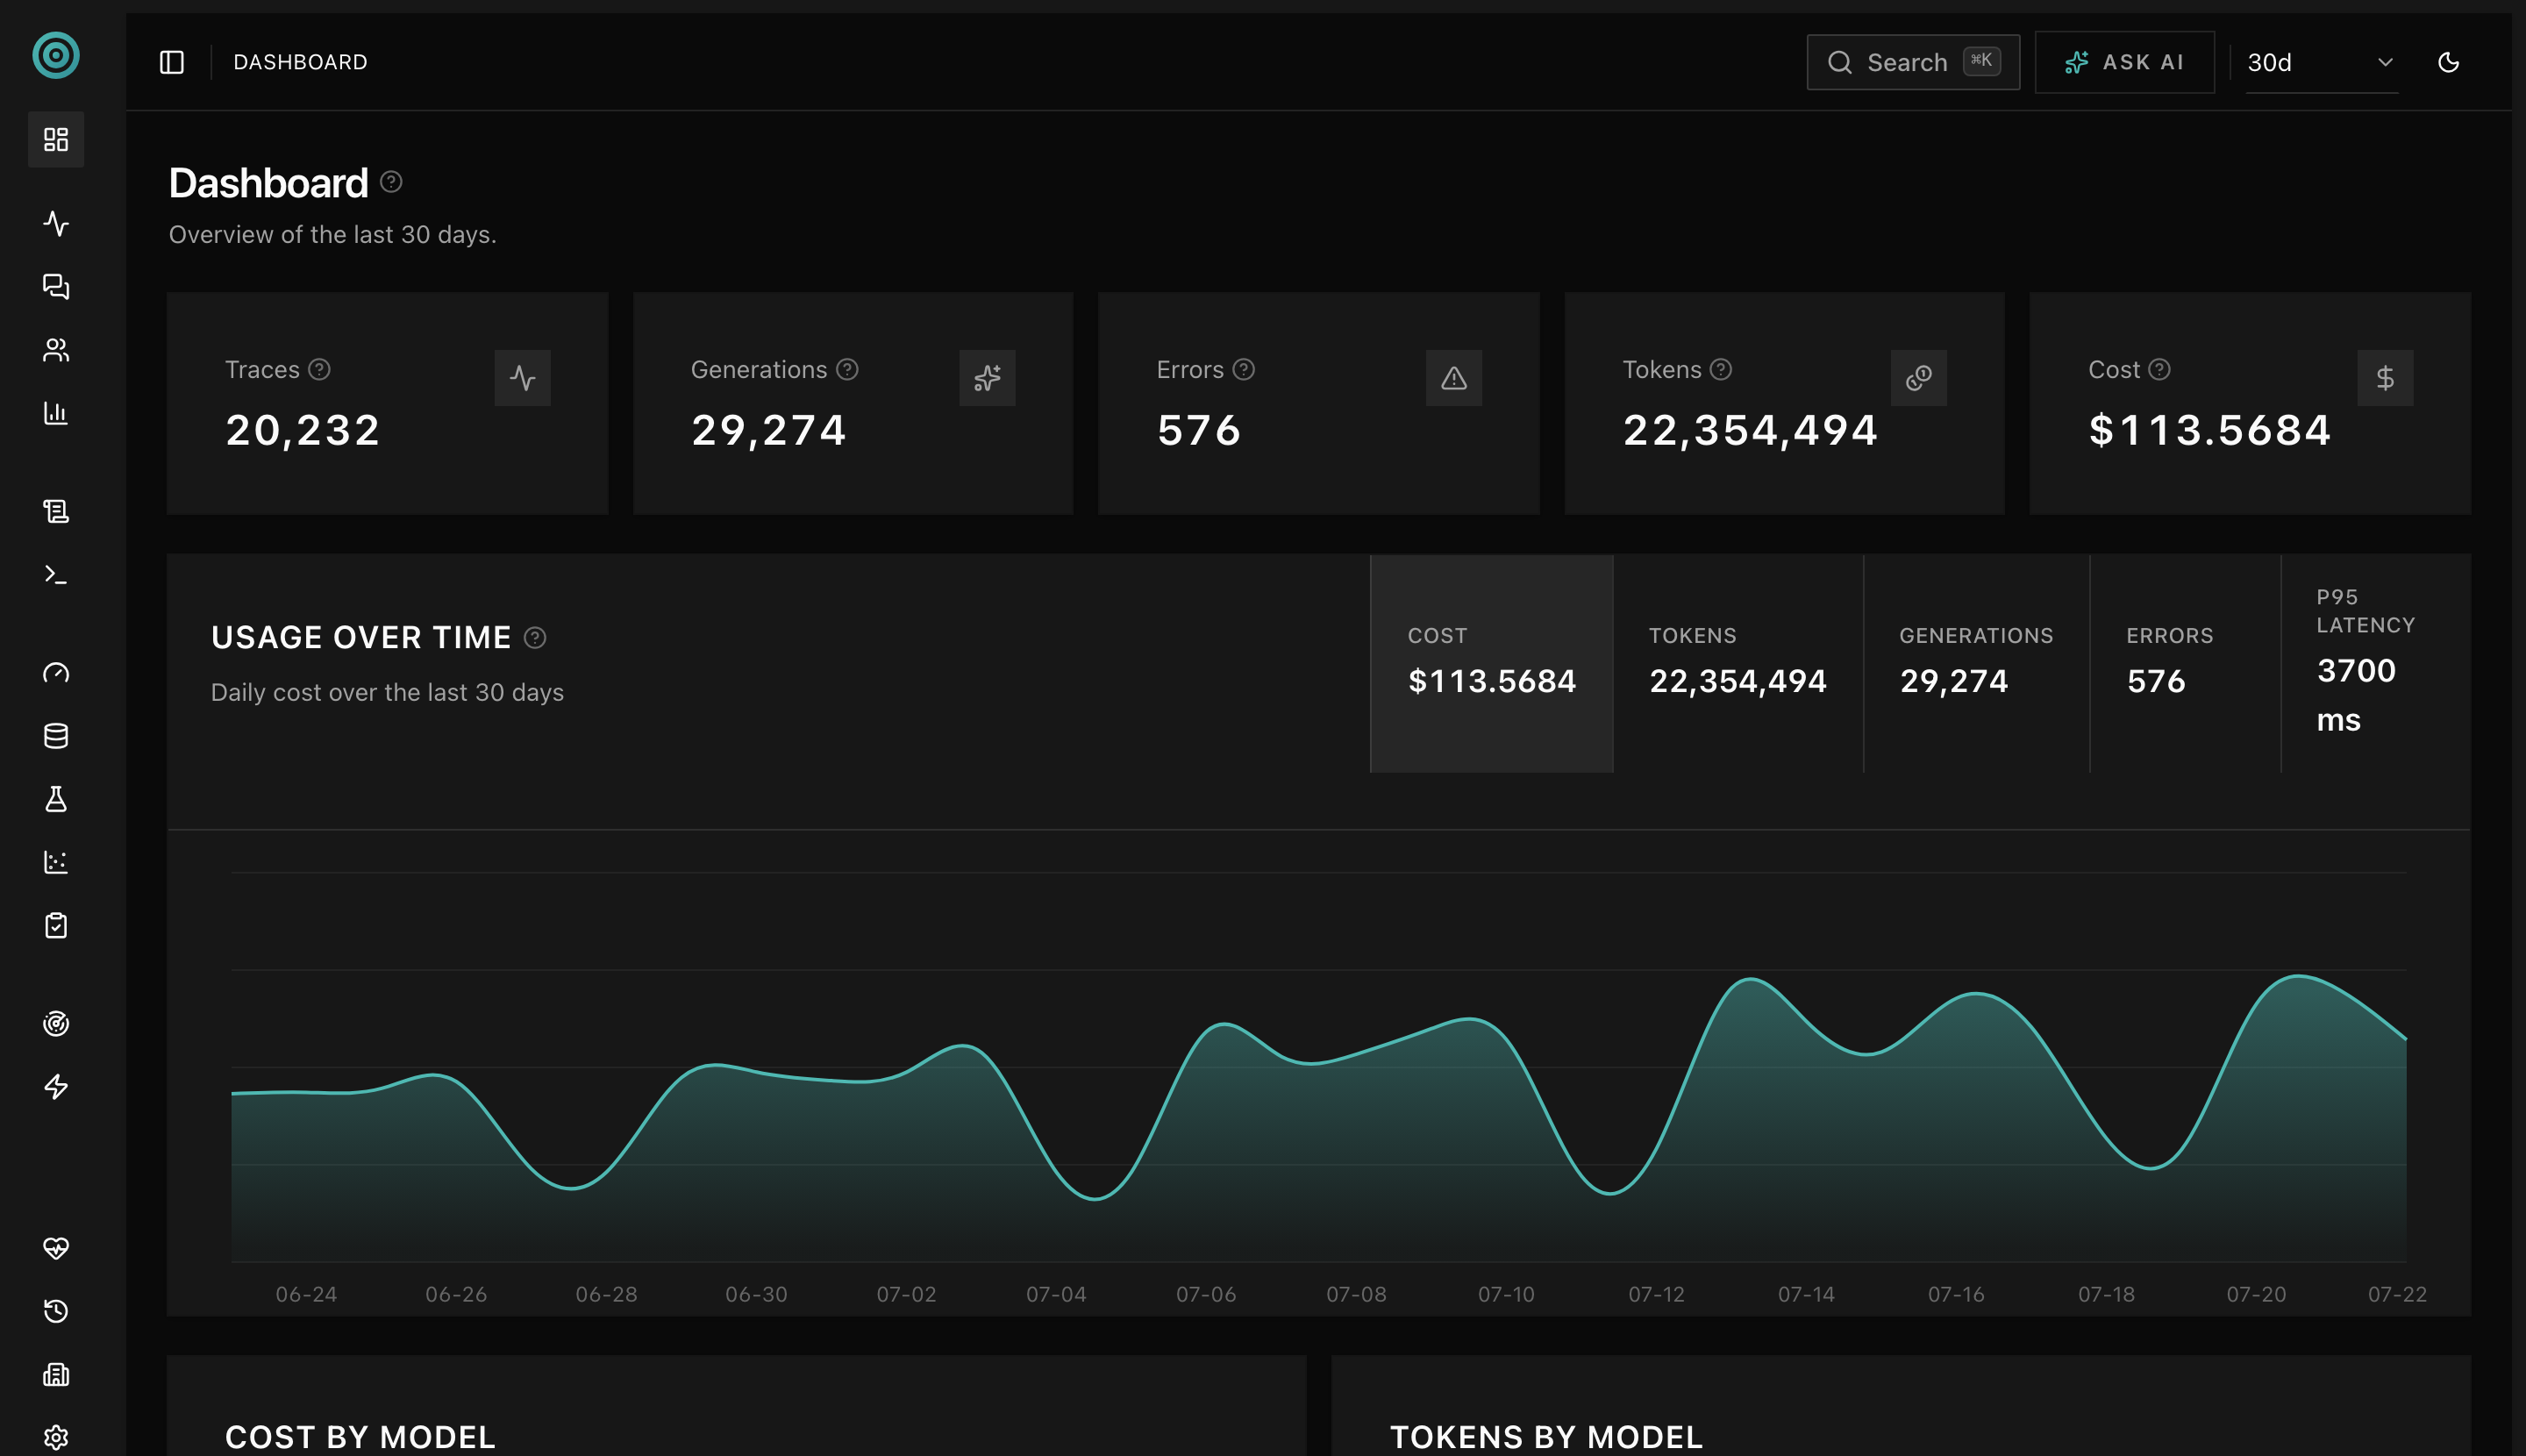
The Memoturn dashboard: traces, generations, errors, tokens, and cost tiles above a 30-day cost chart, with p95 latency at hand.
works with
  • OpenTelemetry
  • OpenAI
  • Anthropic
  • LangChain
  • LiteLLM
  • MCP
OTLP · GenAI semconv

LLM apps ship blind. No cost visibility, silent quality regressions, prompts versioned in a Slack thread.

The observability stack the LLM SaaS vendors run — traces, eval pipelines, prompt registries — rebuilt on open infrastructure: Postgres, Apache Doris, Redis, S3. One docker compose away, and your telemetry never leaves your network.

The full AI engineering loop. Every piece open.

No proprietary cloud, no black boxes. Observe what your app does, evaluate whether it's good, and ship the next prompt: one platform you can inspect, extend, and self-host.

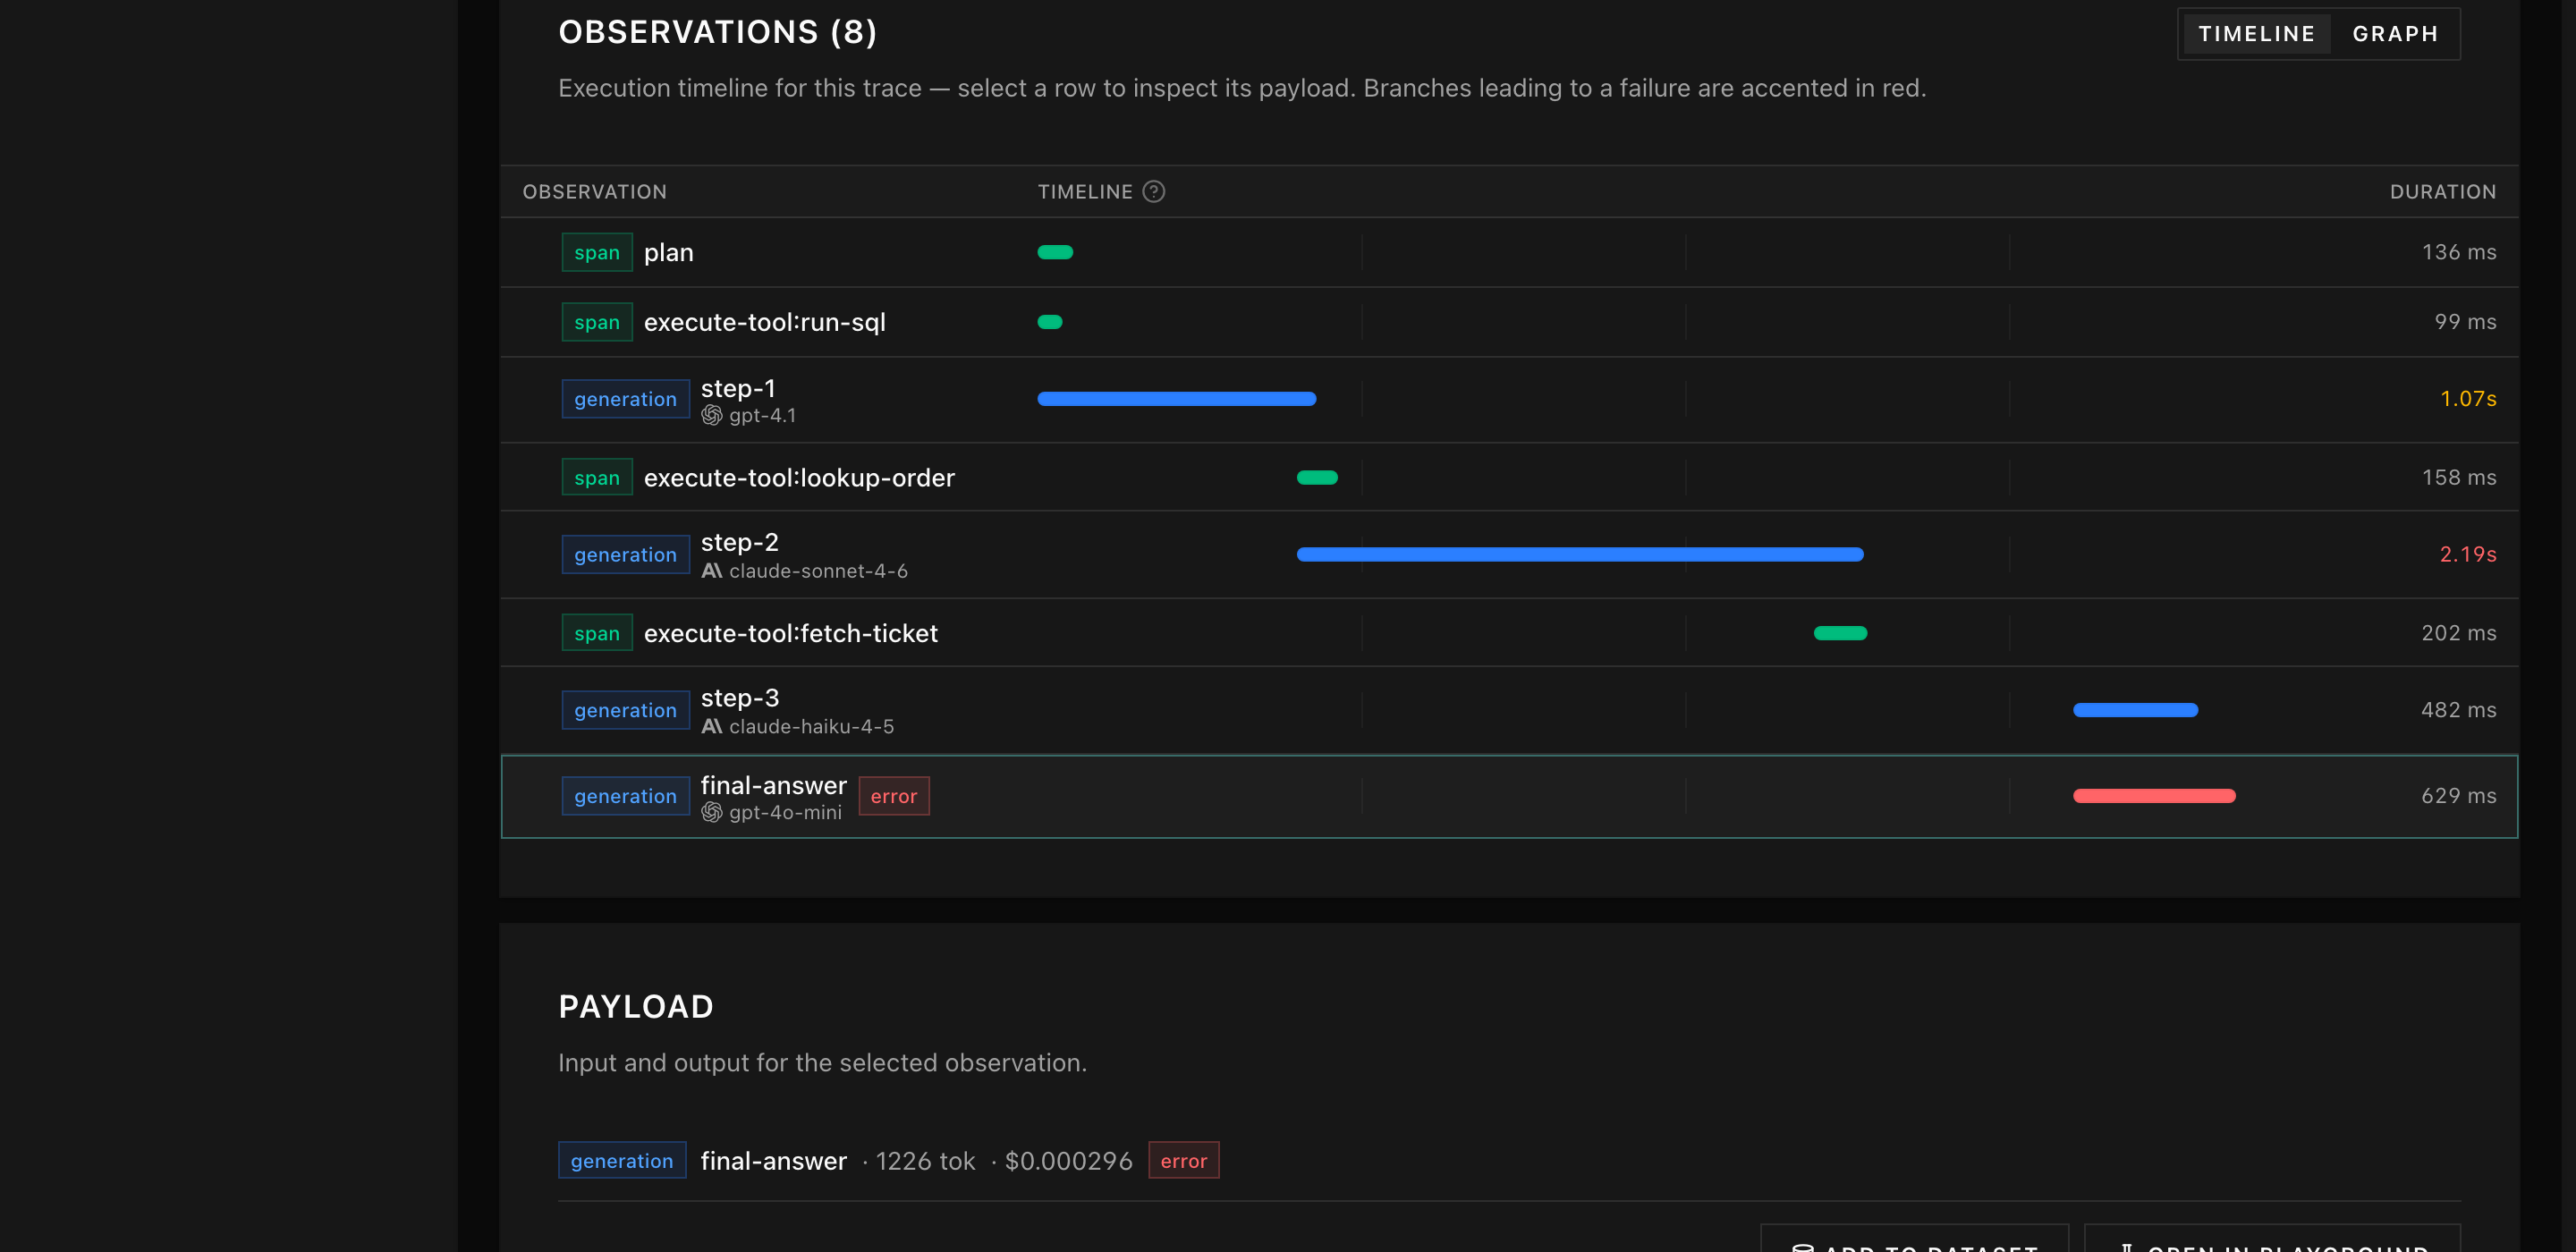
An agent-loop trace in the Memoturn console: eight observations on a waterfall timeline, tool spans in green, generations in blue, the failing final-answer call accented in red.

Every call, traced

Traces, spans, generations, and scores on a waterfall timeline, with sessions and per-user rollups. Ingest from the SDKs, the OpenAI and LangChain wrappers, or any OpenTelemetry exporter speaking OTLP/JSON with GenAI semantic conventions.

traceswaterfallOTel
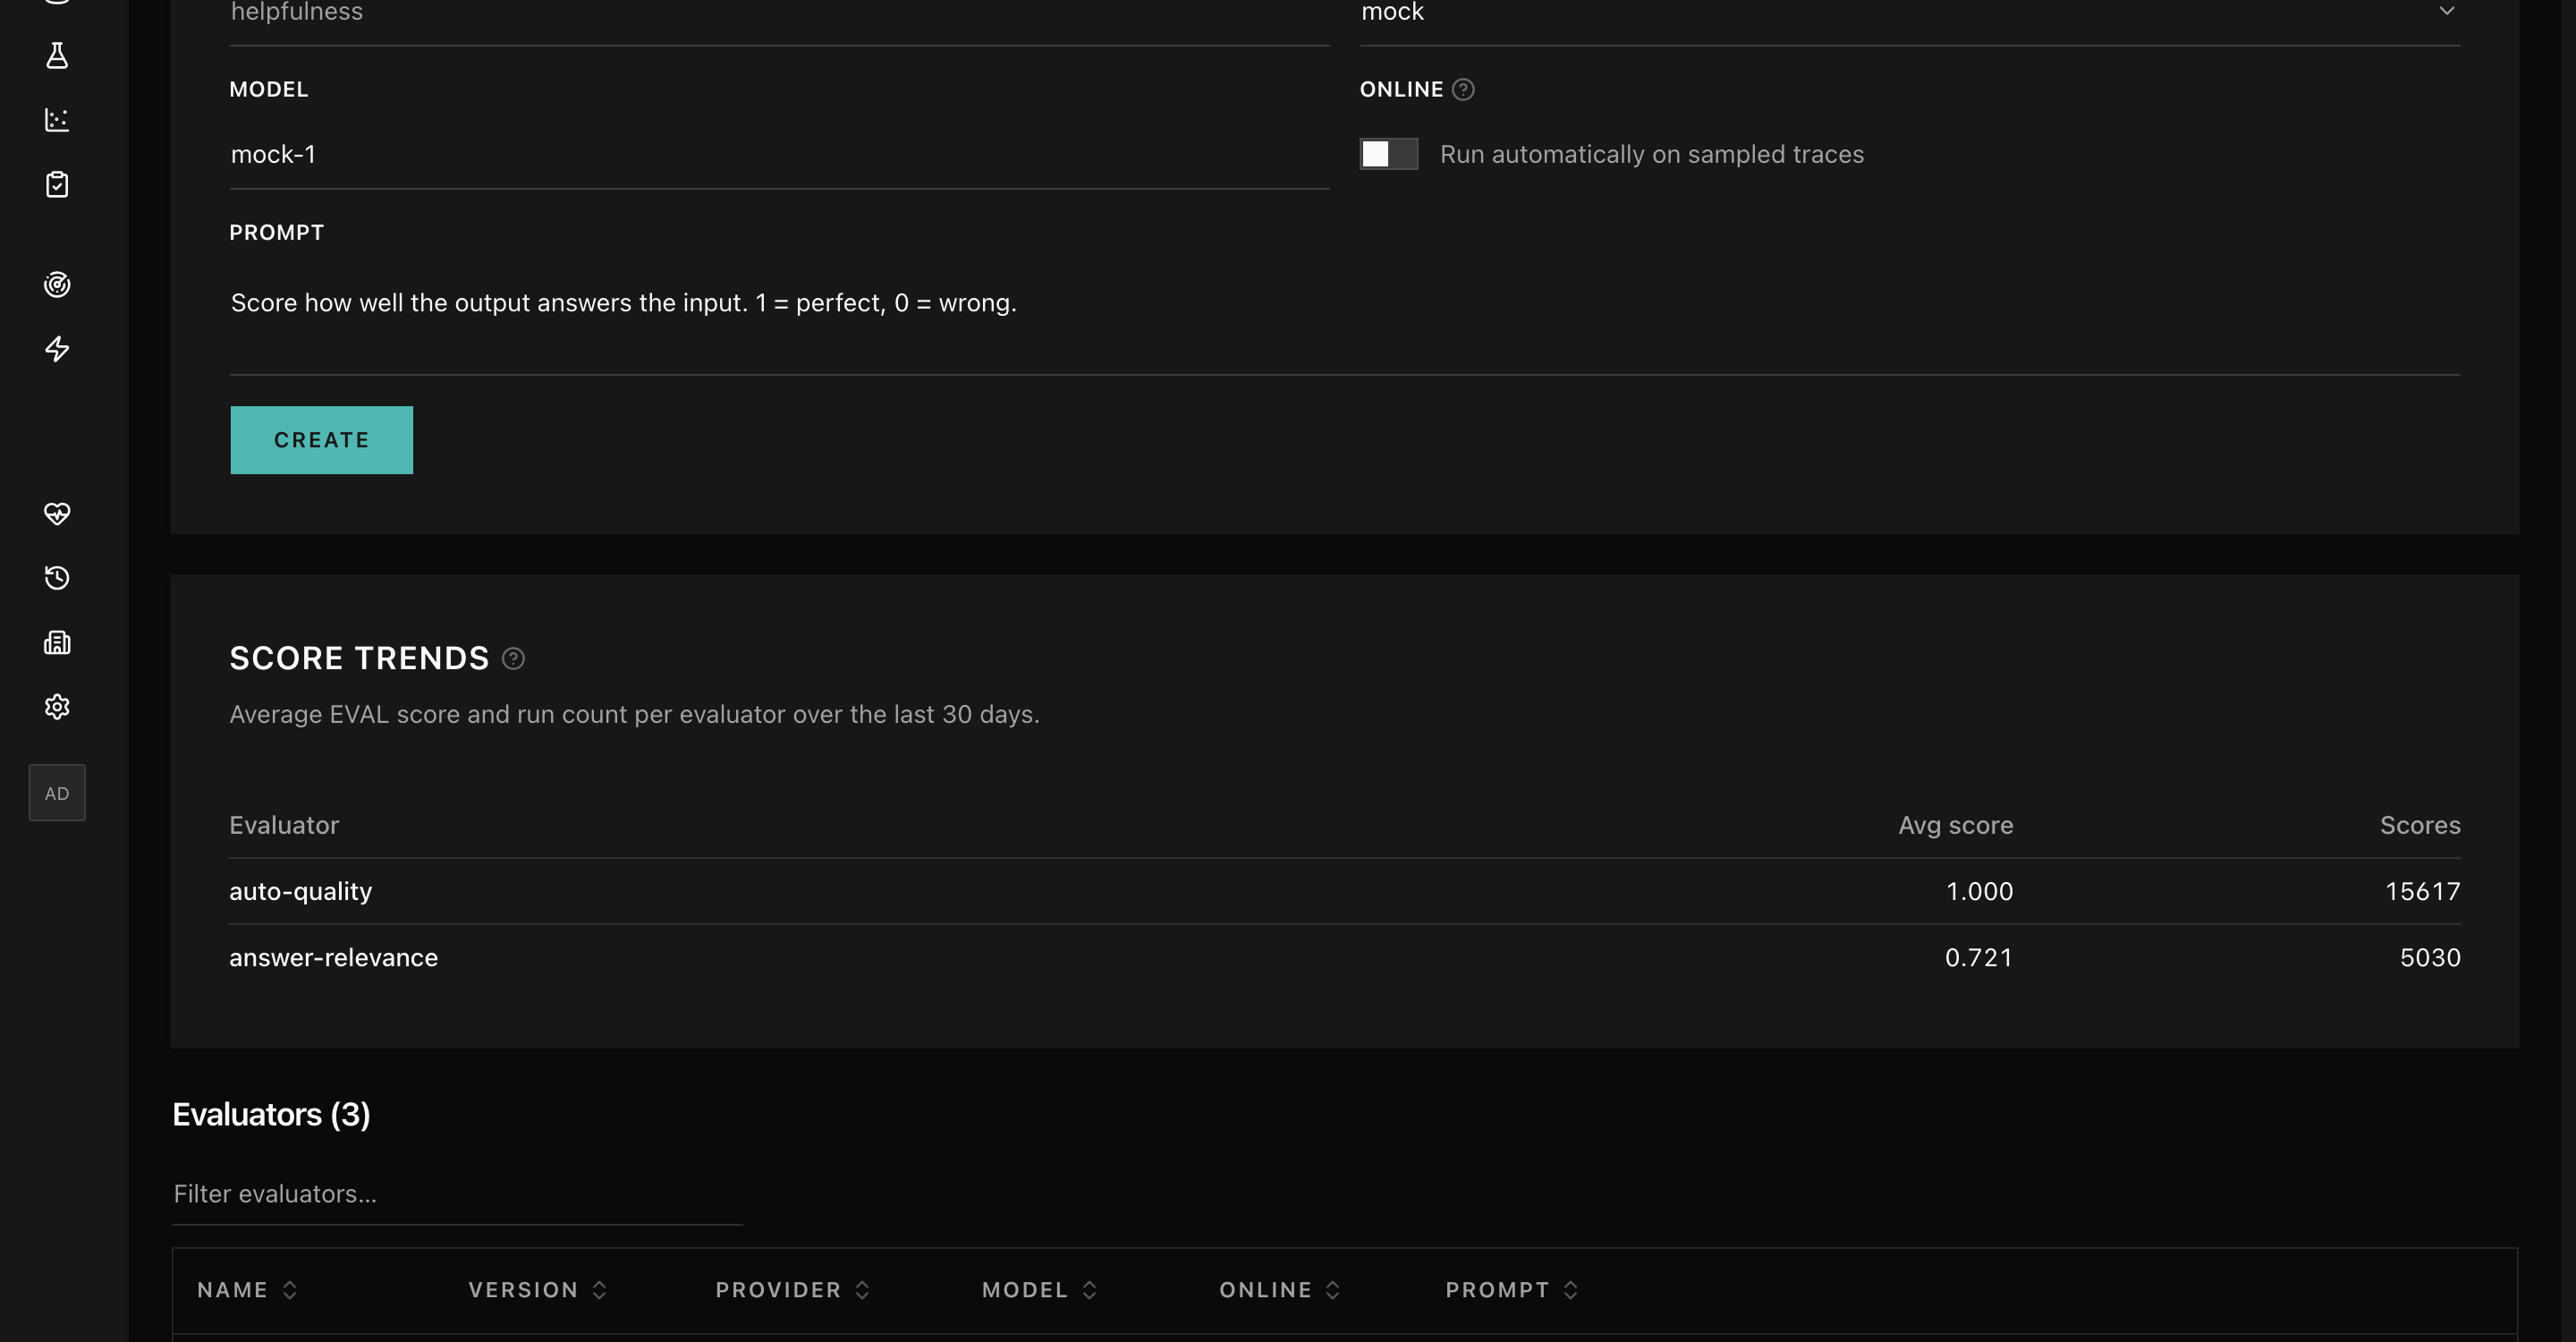
The evaluators page in the Memoturn console: score trends per evaluator and the evaluator registry with online sampling rates.

Evals, three ways

Offline experiments over datasets, online evaluators sampling production traces, and human review queues with one-click scoring. Every score lands in Doris and shows up on the trace it came from.

offlineonlinehuman review
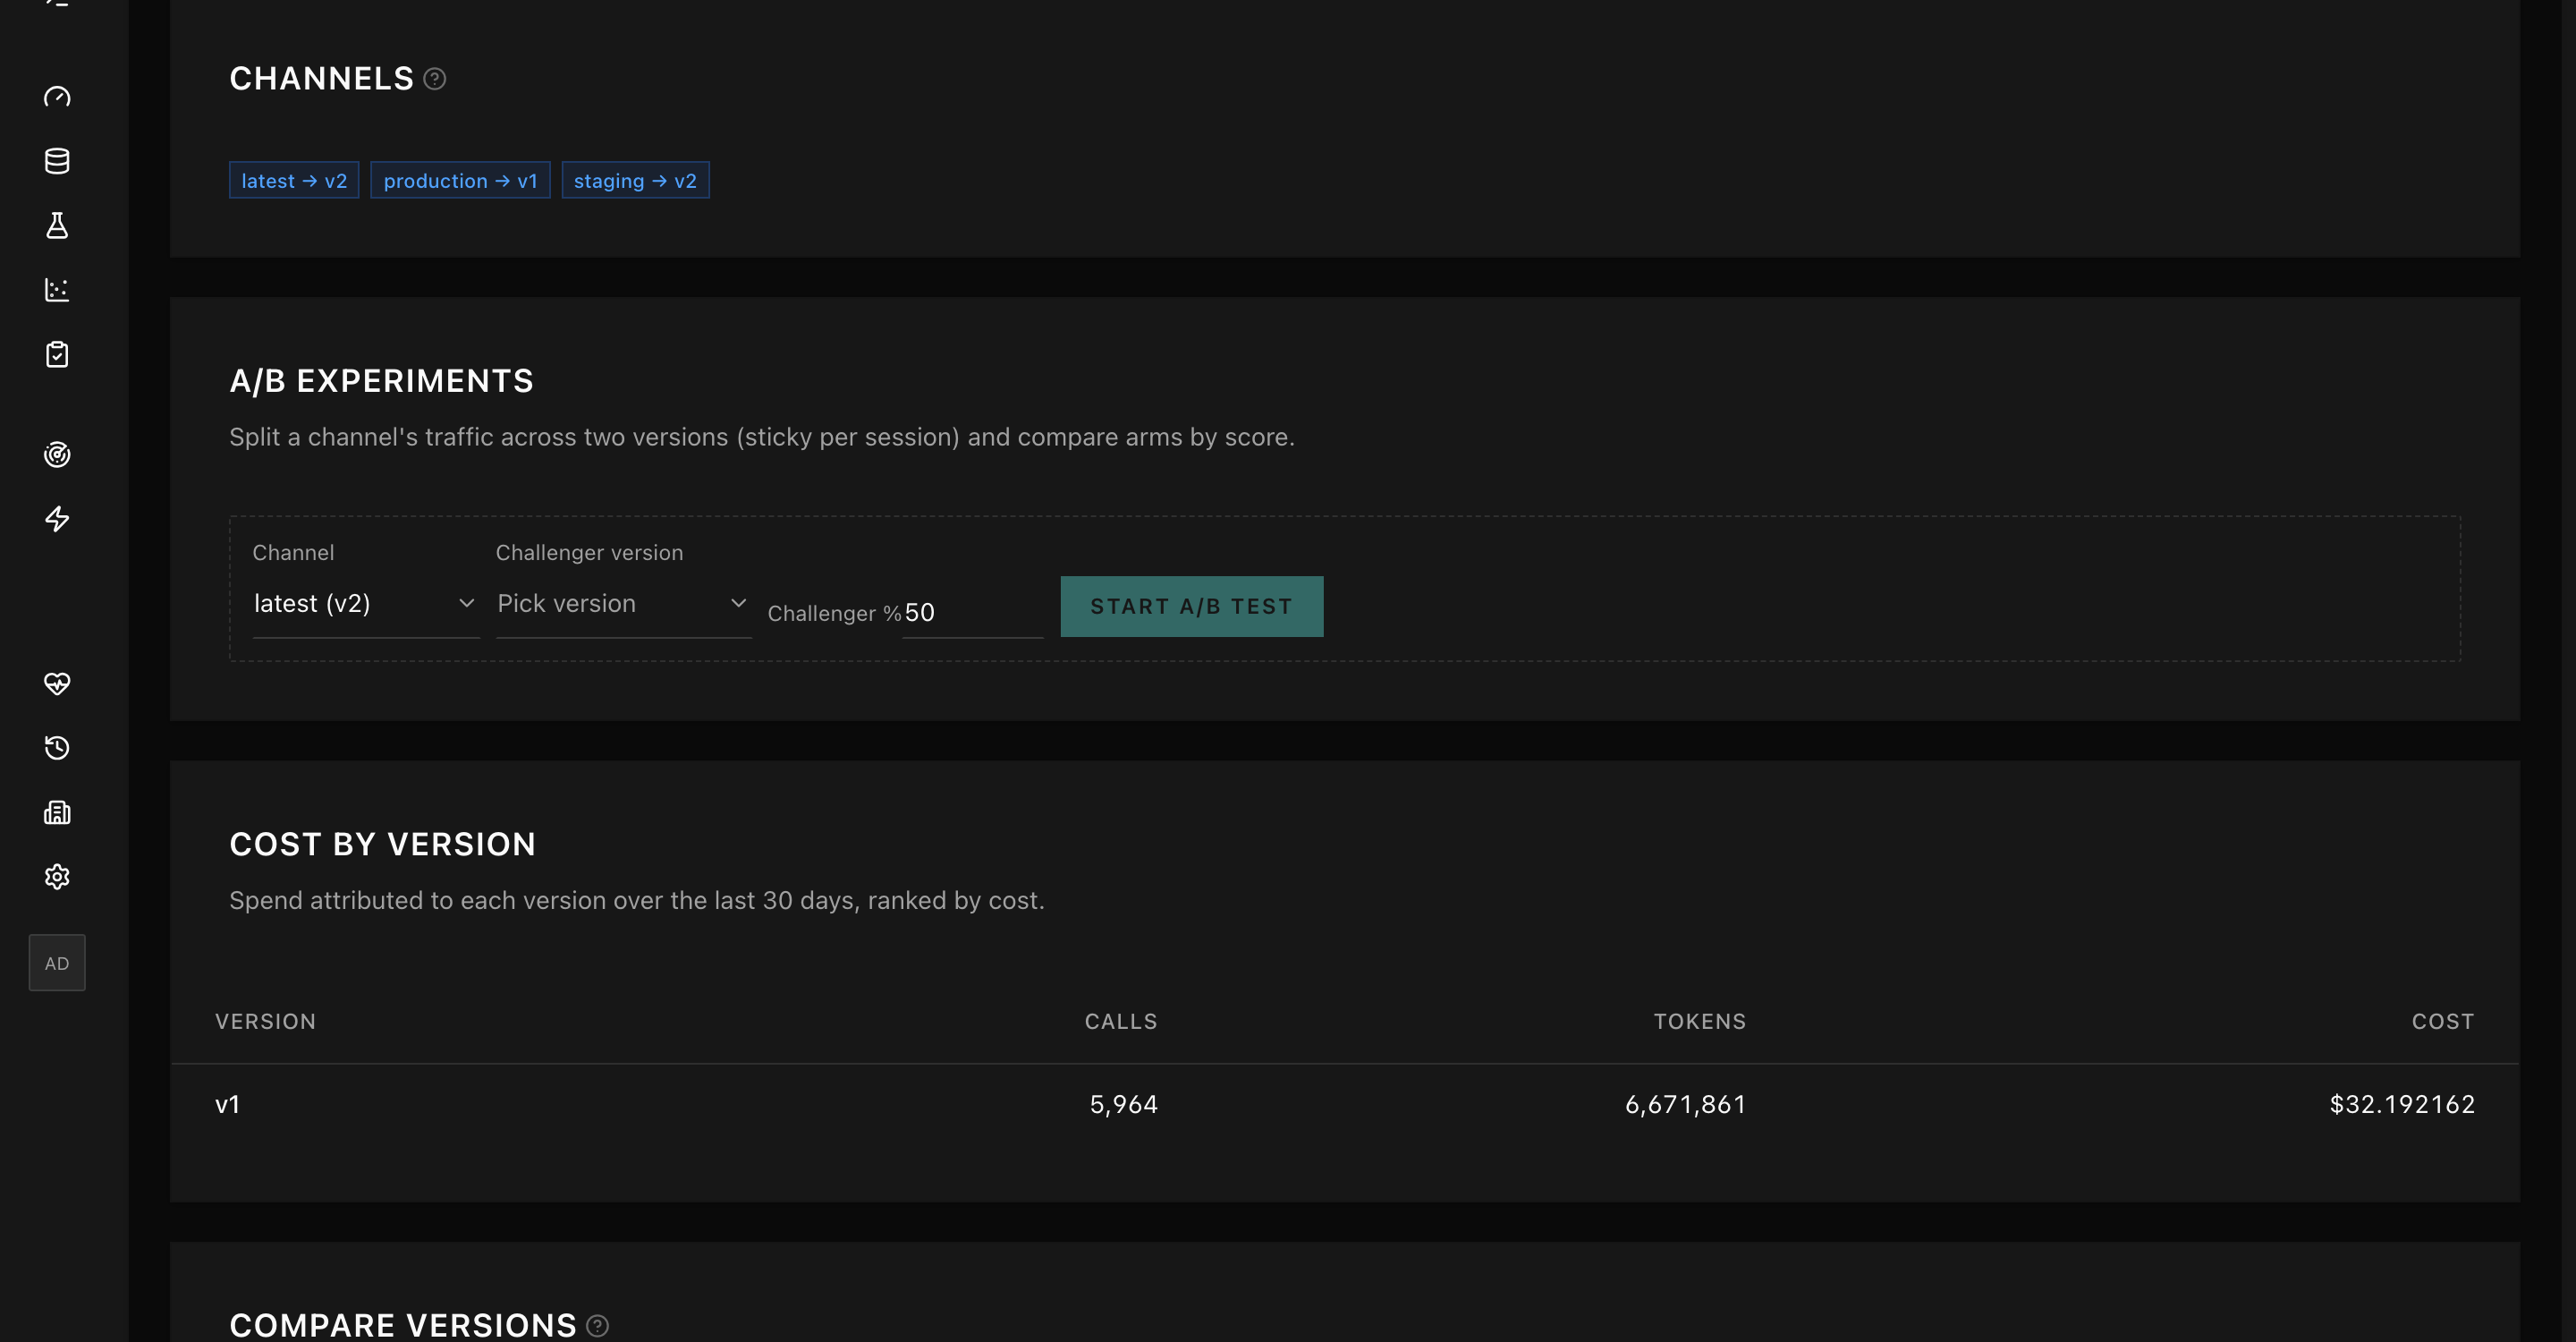
A prompt in the Memoturn console: deployment channels, an A/B experiment form splitting traffic between versions, and cost attributed per version.

Prompts with deploy channels

A versioned prompt registry with production, staging, and custom channels, plus A/B experiments that split live traffic between versions and compare arms by score. Fetch with getPrompt and iterate in a multi-provider streaming playground.

versionedchannelsA/B tests

Also on the platform

metrics & dashboards

Cost, tokens, and latency (p50/p95) over a Doris rollup, sliced by day, model, user, session, and tool. Pin filtered metrics to custom dashboards and saved views.

monitors & automations

Stateful alert rules and cost budgets evaluated every minute, plus trigger-to-action rules on platform events that fire webhooks or Slack messages when a score drops or spend spikes.

datasets & experiments

Dataset items and experiment runs that link every item to the trace it produced. Benchmark prompts and models side by side in a comparison matrix before anything ships.

embeddings & search

Embedding projections over your traces and semantic find-similar search, so one bad generation leads you to every trace that means the same thing.

playground

Multi-provider with streaming, structured output, and tool calling. Every playground run is recorded as a trace, and any trace payload opens back into the playground.

MCP server

Prompts, datasets, and review queues exposed as tools inside agent IDEs like Claude Code and Cursor, as a local stdio server or over Streamable HTTP per project, with per-tool RBAC.

The enterprise tier is the free tier.

SSO, RBAC, audit logs, and PII masking are where observability vendors put the paywall. In Memoturn, every one of these ships in the Apache-2.0 core. Self-host it, pass your security review, and pay nobody.

SSO
OIDC and SAML via your own IdP, mapped by email domain.
RBAC
Owner, admin, member, and read-only viewer roles per organization.
Audit logs
Every mutating action recorded with actor, action, and target.
PII masking
Masking rules applied at ingest, before anything is stored.
Retention & exports
Per-project retention policies and scheduled NDJSON exports to blob.
Keys & rate limits
API-key management and per-project rate limits.

From first trace to shipped prompt. One loop.

The same traces, scores, datasets, and prompt versions back every workflow, from debugging a single request to benchmarking a model swap, all on infrastructure you own.

Debug production LLM traffic

Follow a request through every span and generation on the waterfall timeline, with full input/output payloads and session grouping across turns.

Track spend by model & feature

Cost, token, and latency rollups per day, model, user, and tool out of Doris. Know what each feature costs before the invoice tells you.

Catch regressions before users do

Online evaluators sample live production traces and score them continuously; monitors turn a bad score or a cost spike into a Slack alert or webhook.

Ship prompts like code

Versioned, immutable prompt registry with deployment channels: promote to production, A/B test challengers on live traffic, roll back instantly.

Benchmark models & prompts

Run experiments over datasets, score them with LLM-as-judge evaluators, and compare runs side by side before switching models.

Self-host for compliance

PII masking at ingest, audit logs, retention policies, and scheduled exports, with every byte of telemetry staying on your infrastructure.

Trace your first LLM call in minutes.

Open source, Apache-2.0. One command locally, docker compose for production, Helm on Kubernetes when you outgrow one host.